Example 1: Charting Data From an API
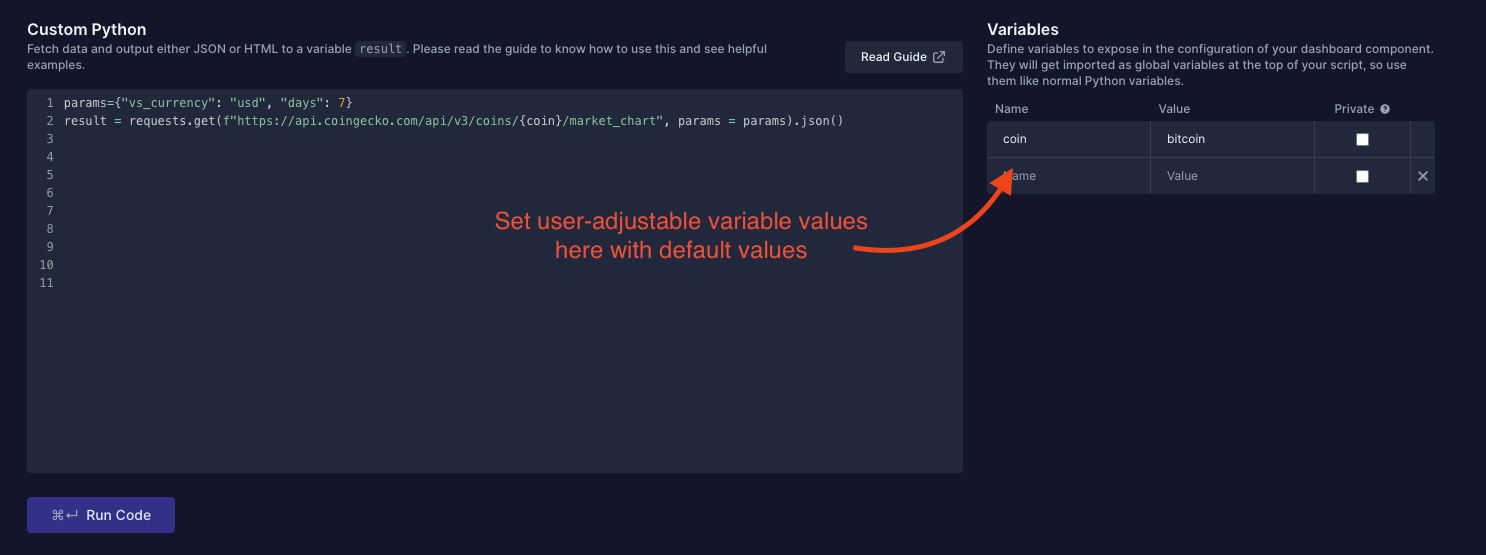
Here, we create a component that plots historical prices of cryptocurrencies using coingecko. Since the requests library is already pre-imported, our python script is only two lines:
params={"vs_currency": "usd", "days": 7}
result = requests.get(f"https://api.coingecko.com/api/v3/coins/{coin}/market_chart", params = params).json()
It is important to note that the final exported values must be in a variable called "result", returned as a json object.
We can input user-adjustable variables on the left side of the script. These variables can be changed on the front end (if not marked as private), and used within the script. Here, we allow the user to adjust the coin that is input.

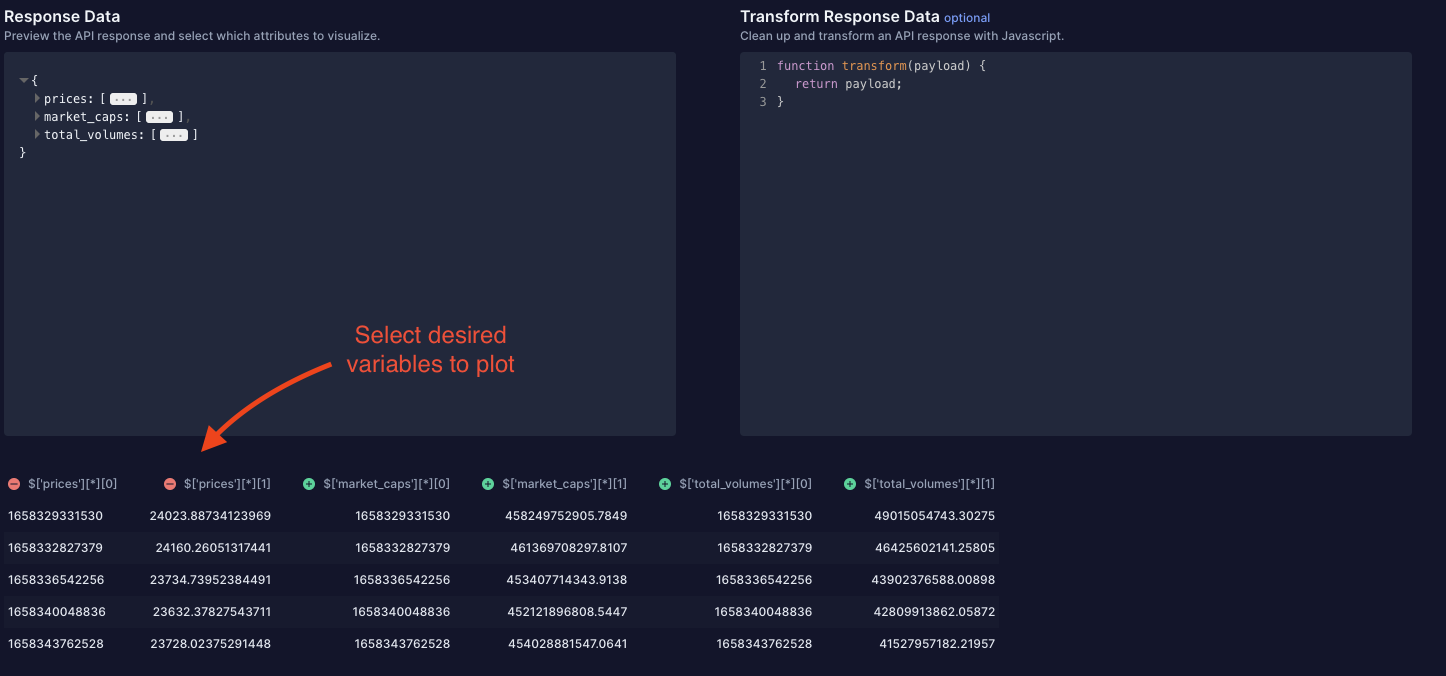
Once the code is run, we can see the output appear below. In this example, we will use The Tie's built-in charting feature to chart prices over time. First, we select the variables we want to plot by clicking the green circles next to the desired variable columns.

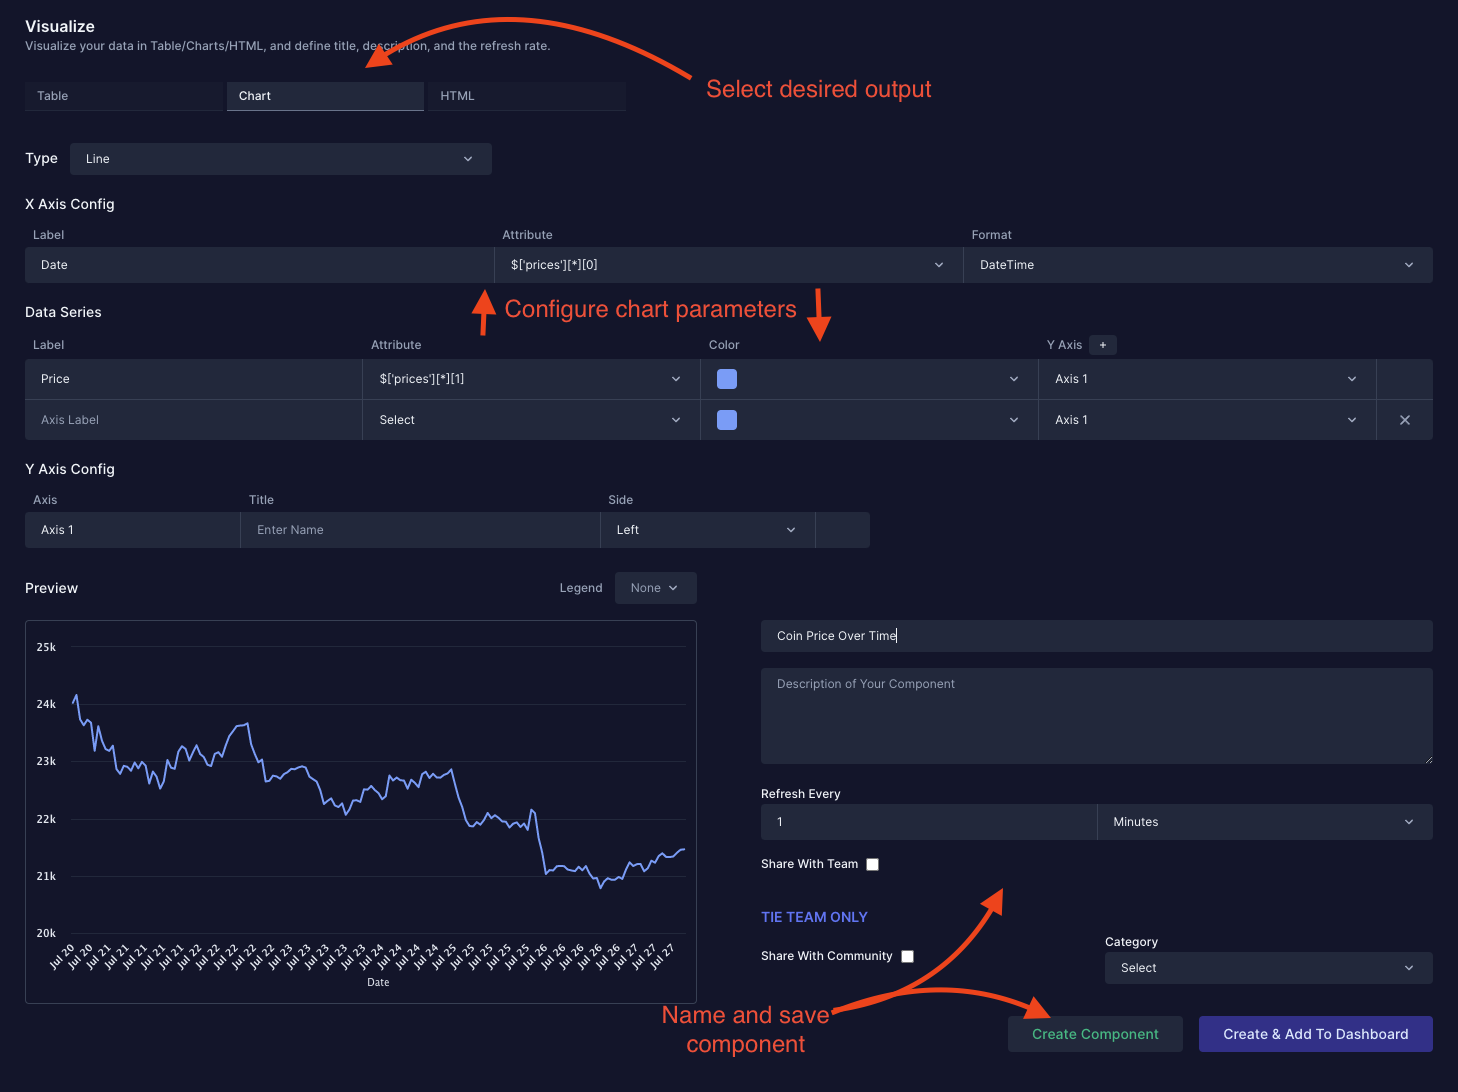
Next we configure chart parameters. As we set up this configuration, we can see the chart take form at the bottom of the screen. Once complete, name the component (e.g., "Coingecko Price over time"), and save the component. It will now be available in "Your Components".

Updated 3 months ago